Debug Go microservices locally while testing against dependencies in a remote Kubernetes cluster
Many organizations adopt cloud native development practices with the dream of shipping features faster. Although the technologies and architectures may change when moving to the cloud, the fact that we all still add the occasional bug to our code remains constant. The snag is that many of your existing local debugging tools and practices can’t be used when everything is running in a container or on the cloud.
Easy and efficient debugging is essential to being a productive engineer, but when you have a large number of microservices running in Kubernetes the approach you take to debugging has to change. For one, you typically can’t run all of your dependent services on your local machine. This then opens up the challenges of remote debugging (and the associated fiddling with debug modes and exposing ports correctly). However, there is another way. Telepresence enables this path.
This article walks you through using Telepresence to seamlessly connect your local development machine to a remote Kubernetes cluster, allowing you to use your favorite debugging tools with all of your microservices. Giving you the ability to comfortably debug your remote apps with your existing skills.
The Difficulty with Debugging Applications Running in Kubernetes
Splitting your application into microservices introduces a number of challenges. Particularly with debugging. Splitting an application into several, if not dozens, of microservices creates a complex dependency tree that becomes nearly impossible to replicate in staging.
Sure, you can use unit tests with tools like GoMock and GoStub to simulate external dependencies or introduce synthetic data into the mix, but it still leaves you unsure if it will work with data from your actual services.
And after you have deployed your service into your cluster, running a remote debugging session can be tricky to get right, due to the complicated configuration of ports and protocols that need to be set via your Kubernetes service YAML. You often lose the ability to use your favorite debugging tools and strategies.
Step 1: Deploy a Sample Microservice Application
In this article, we’re going to be working with the sample Edgey Corp application written in Go. Or just apply the YAML from the URL to your Kubernetes cluster, clone the repository, and jump right into the action.
- Apply the manifest for the Edgey Corp app to your K8s cluster
kubectl apply - https://raw.githubusercontent.com/datawire/edgey-corp-go/main/k8s-config/edgey-corp-web-app-no-mapping.yaml
2. Git clone the code for the Edgey Corp app to your machine
git clone
Now that we have the Edgey Corp app running in our Kubernetes cluster, and we have the code on our local machine let’s pop it open with VSCode.
Let’s check the application is running successfully. Run a
kubectl get pods
to see the pods are up and running for the 3 microservices.
verylargedatastore
,
verylargejavaservice
and
dataprocessingservice
.
$ kubectl get pods
NAME READY STATUS RESTARTS AGE
verylargedatastore-cd998dfc6-k5bkw 1/1 Running 0 19s
verylargejavaservice-77748f79d6-dx4kj 1/1 Running 0 20s
dataprocessingservice-f5b644d95-s98hp 1/1 Running 0 20s
With the sample application up and running we can configure VScode to start debugging.
Step 2: Configure VScode and Delve
VScode is a great all-purpose IDE with countless extensions to get you up and running quickly. We are going to use the Go extension made by the Google team with the Go debugger tool called Delve. Here are links to each tool:
You’ll want to make sure that Delve is both installed to your local system and connected to VScode through the Go extension.
Install Delve to your local system
go install github.com/go-delve/delve/cmd/dlv@latest
Connect Delve to VScode
- Open VScode now
2. Access the command palette with (command+shift+p)
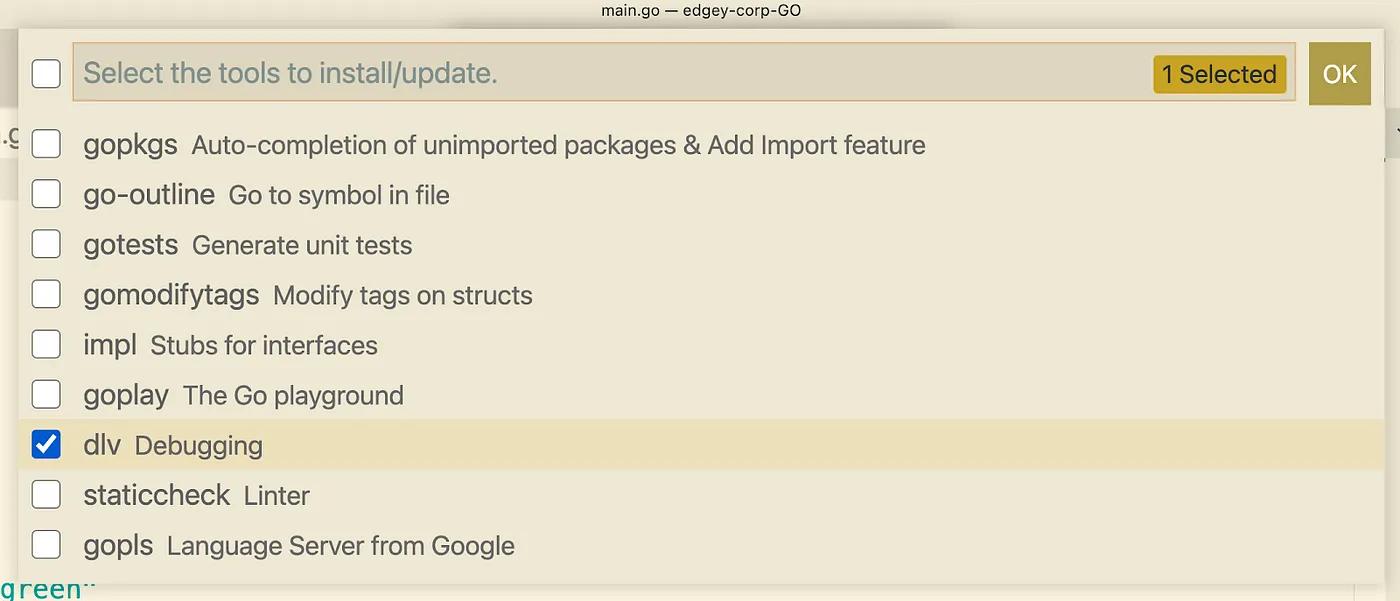
3. Select
Go: install/update tools
.

4. Check the box for DLV and any other options you might find useful.
5. Click Ok
Run your Go code in debugging mode
- Open the project directory for the Edgy Corp Go App in VScode
- Open up the file
dataprocessingservice/main.go
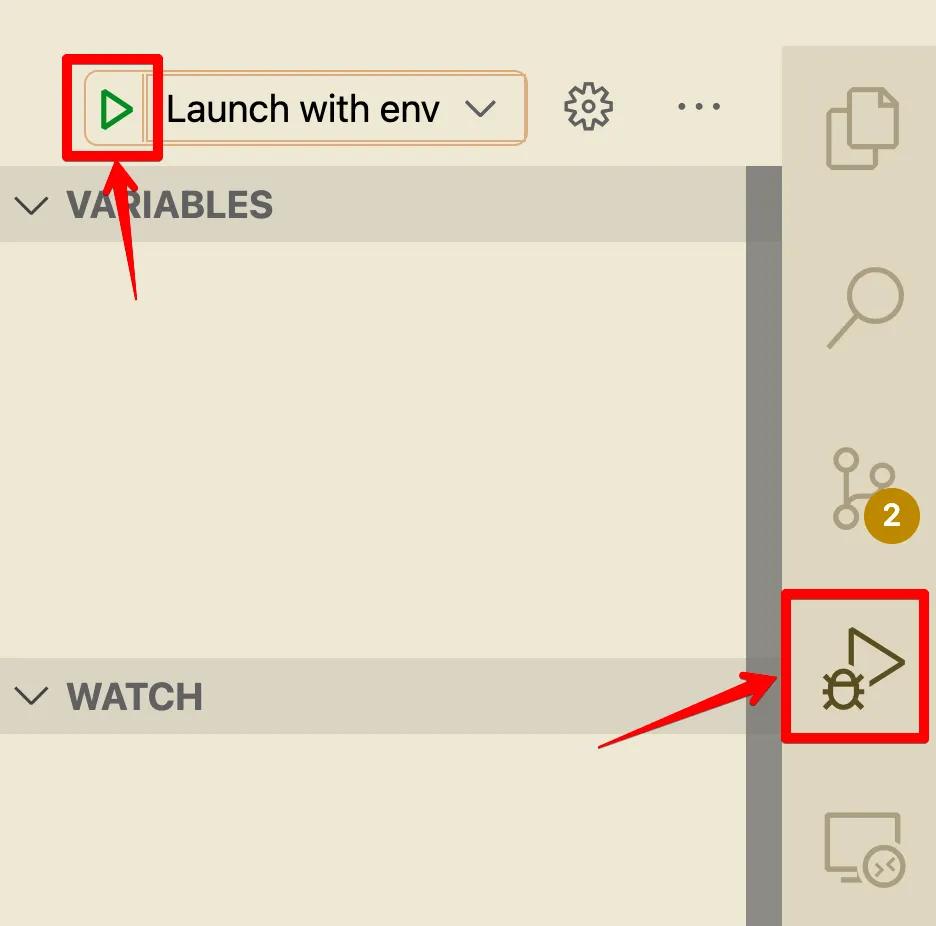
- Click the debug icon on the right side.
- Lastly, click “Run and Debug”

You should now see the debug console starting to log output.
API server listening at: 127.0.0.1:48808Welcome to the DataProcessingGoService!
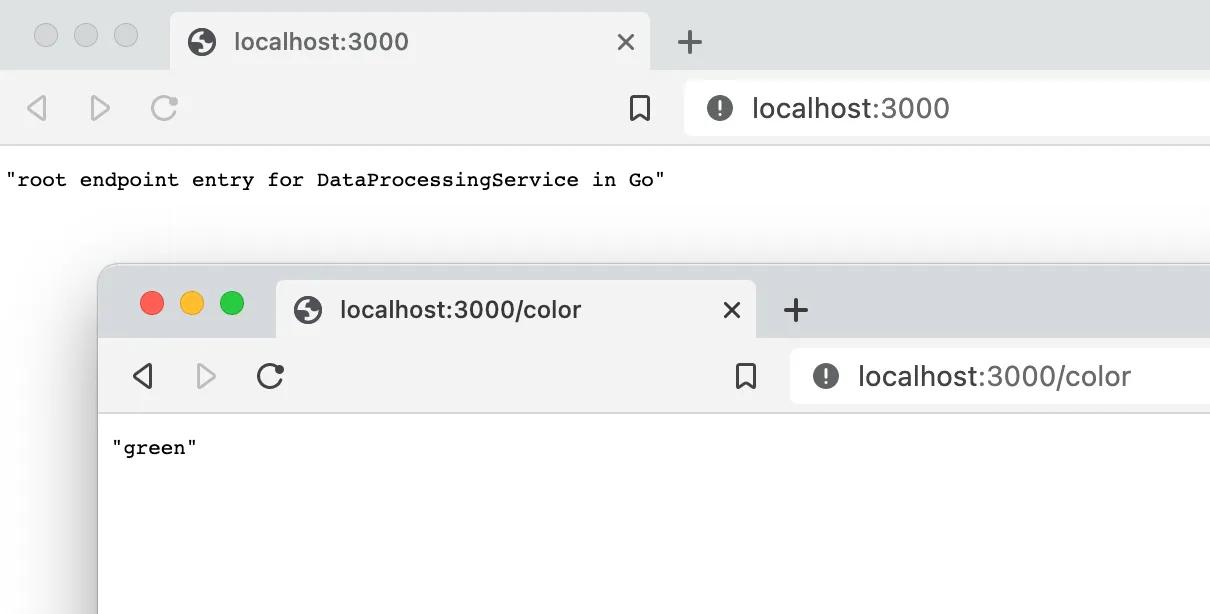
Let’s check that it’s working by navigating to localhost:3000 in your browser. You can also navigate to localhost:3000/color to see how the Go application response to the color endpoint.
Step 3: Intercept Your Service with Telepresence
So debugging one microservice in isolation is fine, but it still leaves us assuming what is going to happen when it is connected to the rest of the microservice in our application. Let’s introduce Telepresence here to debug our local Go microservice as part of the larger application.
- Install telepresence CLI
macOS
sudo curl -fL https://app.getambassador.io/download/tel2/darwin/amd64/latest/telepresence -o /usr/local/bin/telepresence
Linux
sudo curl -fL https://app.getambassador.io/download/tel2/linux/amd64/latest/telepresence -o /usr/local/bin/telepresence
2. Make the binary executable
sudo chmod a+x /usr/local/bin/telepresence
3. Connect your local machine to your Kubernetes cluster.
$ telepresence connect
4. Test the connection by cURL-ling our front-end service via its Kubernetes service name.
$ curl http://verylargejavaservice.default:8080/color“green”
Notice two things here:
A) You are able to refer to the remote Service directly via its internal cluster name as if your development machine is inside the cluster
B) The color returned by the remote
DataProcessingService
is “green”, versus the local result you saw above of “blue”
5. Let’s take our connecting to the cluster a step further now by initiating an intercept from our remote
dataprocessingservice
to our local debug session running on http://localhost:3000. This will send any traffic destined for the remote service down to our debugger
$ telepresence intercept dataprocessingservice --port 3000
Launching Telepresence Daemon v2.1.2 (api v3)
Connecting to traffic manager…
Connected to context peteroneilljr-office-hours ()
Using deployment dataprocessingservice
intercepted
Intercept name: dataprocessingservice
State : ACTIVE
Destination : 127.0.0.1:3000
Intercepting : all TCP connections
6. Let’s try to cURL our front-end service once again. This time we should see our local debugger logging the interaction between the front-end service and our local
dataprocessingservice
.
$ curl
Awesome! Now that our local debugger is hooked up to the remote cluster we should be all set to start debugging!
Step 4: Step Through Your Breakpoints
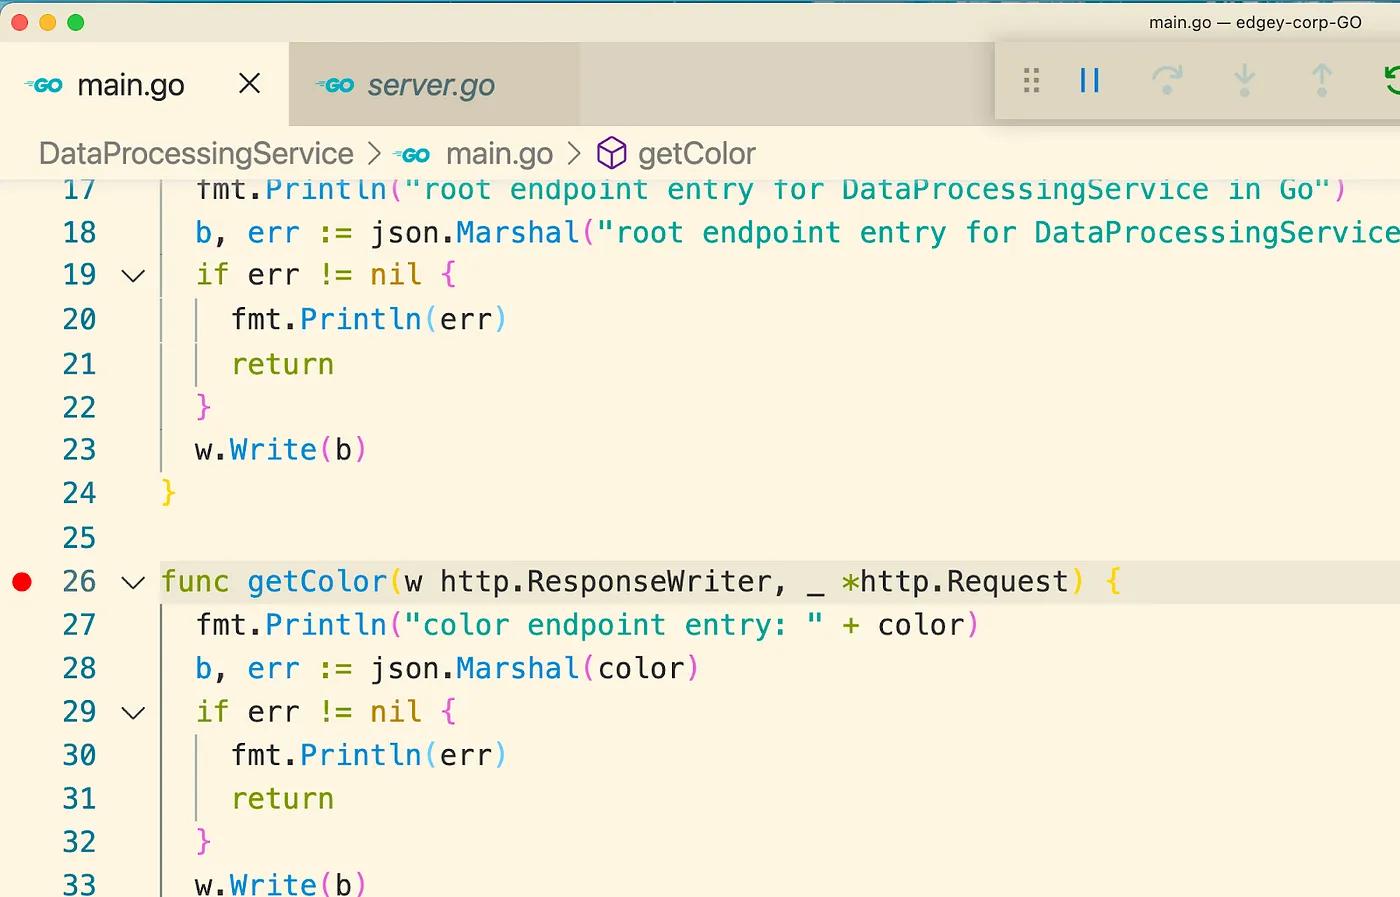
Let’s set a breakpoint on the
getColor
function. Hover over just to the left of the line number and click on the red dot. Once it’s set, visit localhost:3000 in your browser, VScode should pop to the foreground. Click the play button to close the request and the webpage should finish loading.
Now your IDE is processing traffic directly from the cluster, let’s open up our sample application in a web browser:
http://verylargejavaservice.default:8080
VScode will pop open on the breakpoint again. This time let’s click the step button (the one with the clockwise rotating arrow) until the breakpoint reaches the
fmt.Println
and you see the
c: “green”
in the variables window. If you try to adjust the variable directly in the IDE variables pane you will receive the following error.
Failed to set variable — literal string can not be allocated because function calls are not allowed without using ‘call’
More details about the bug here: https://github.com/golang/vscode-go/issues/1173
To work around this issue we can adjust the variable in the debug terminal with the command
call c = “orange”
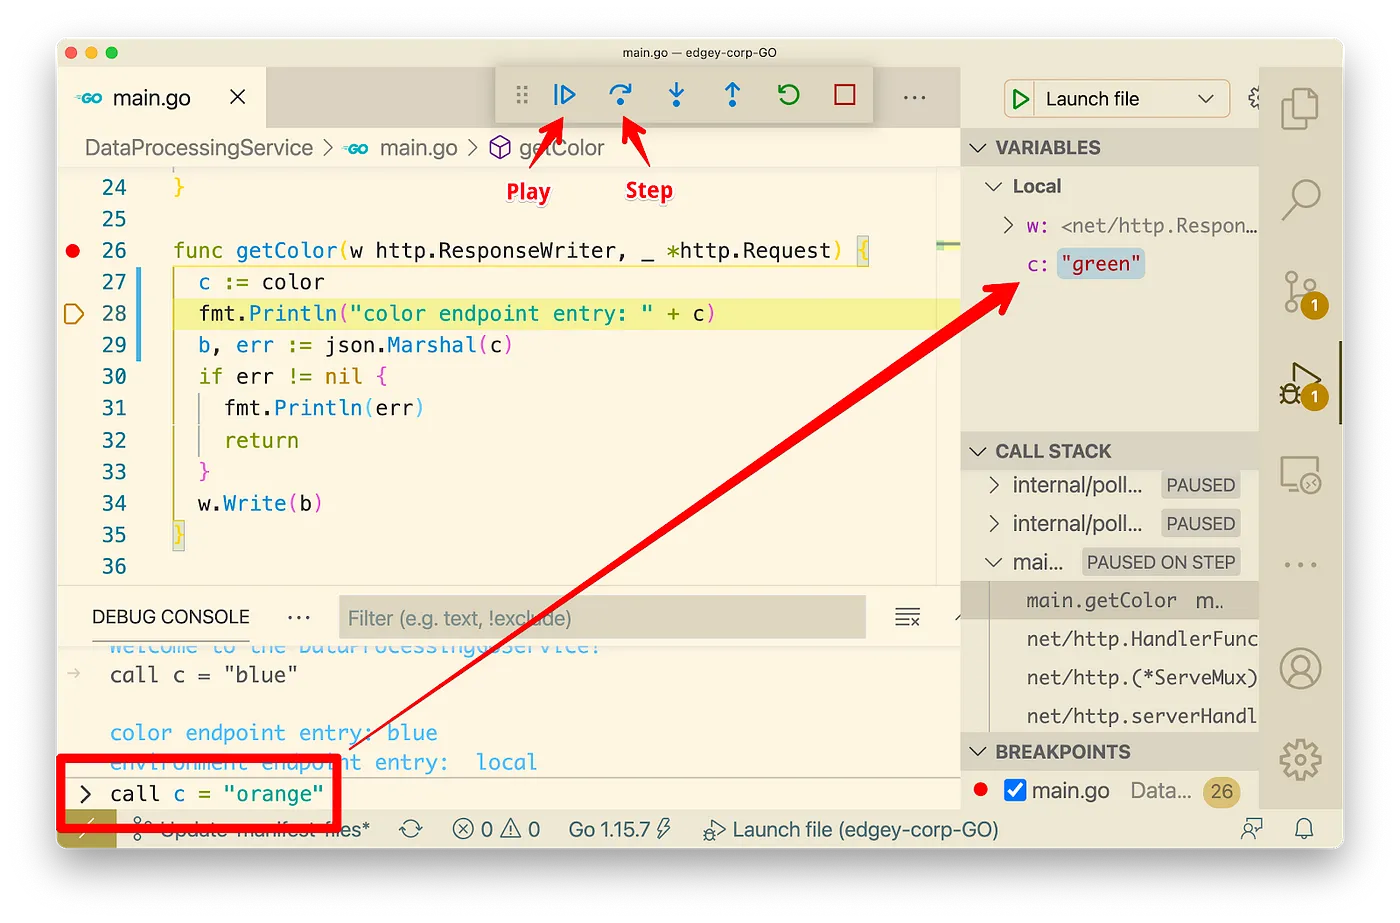
Now let’s end the breakpoint and send the info back to the web browser. Click the play button in the top command bar.
Awesome! You should see the
verylargejavaservice
loading with the orange background colors. We’ve successfully made a request to our front-end service running in our remote cluster, where Telepresence intercepted the traffic sending it through our local debugging session, where we inspected and updated the data to send back the orange color variable.
Introducing Telepresence into the development flow gives us a bridge from our local development environment to our remote Kubernetes cluster. Allowing us to test and debug traffic from the remote cluster as if it was on our local machine, in other words, giving us feedback from our local service to see how it will perform when running in the remote cluster.
Step 5: (Bonus) Clone your Pod’s environment variables to your debug session
In some scenarios, a service can inherit environment variables from the cluster or configuration. In cases like this, cloning the remote deployments environment variables to our local service will be necessary to ensure closer parity between the two environments. To do this we will leverage Telepresence to copy the environment variables from the remote service and save them to a .env file. Then we will tell VScode to add these variables to the debug environment.
To let VScode know that we want to include an environment file, we need to create a launch configuration specifying where the file is going to be.
- Stop your last debugging session if it is still running.
- Click the Gear Icon in the top right corner to open the
launch.json
- file.
- From here click the Add Configuration button.
- Select
Go: Launch File
- from the dropdown menu.
- Add the line
"envFile": "${workspaceFolder}/go-debug.env"

{
"name": "Launch with env file",
"type": "go",
"request": "launch",
"mode": "debug",
"program": "${file}",
"envFile": "${workspaceFolder}/go-debug.env"
}
Now that VScode knows where the file is going to be located let’s generate the file with Telepresence. This time run the intercept from the terminal window within VScode to ensure the file is created in the project directory.
$ telepresence intercept dataprocessingservice — port=3000 — env-file=go-debug.env
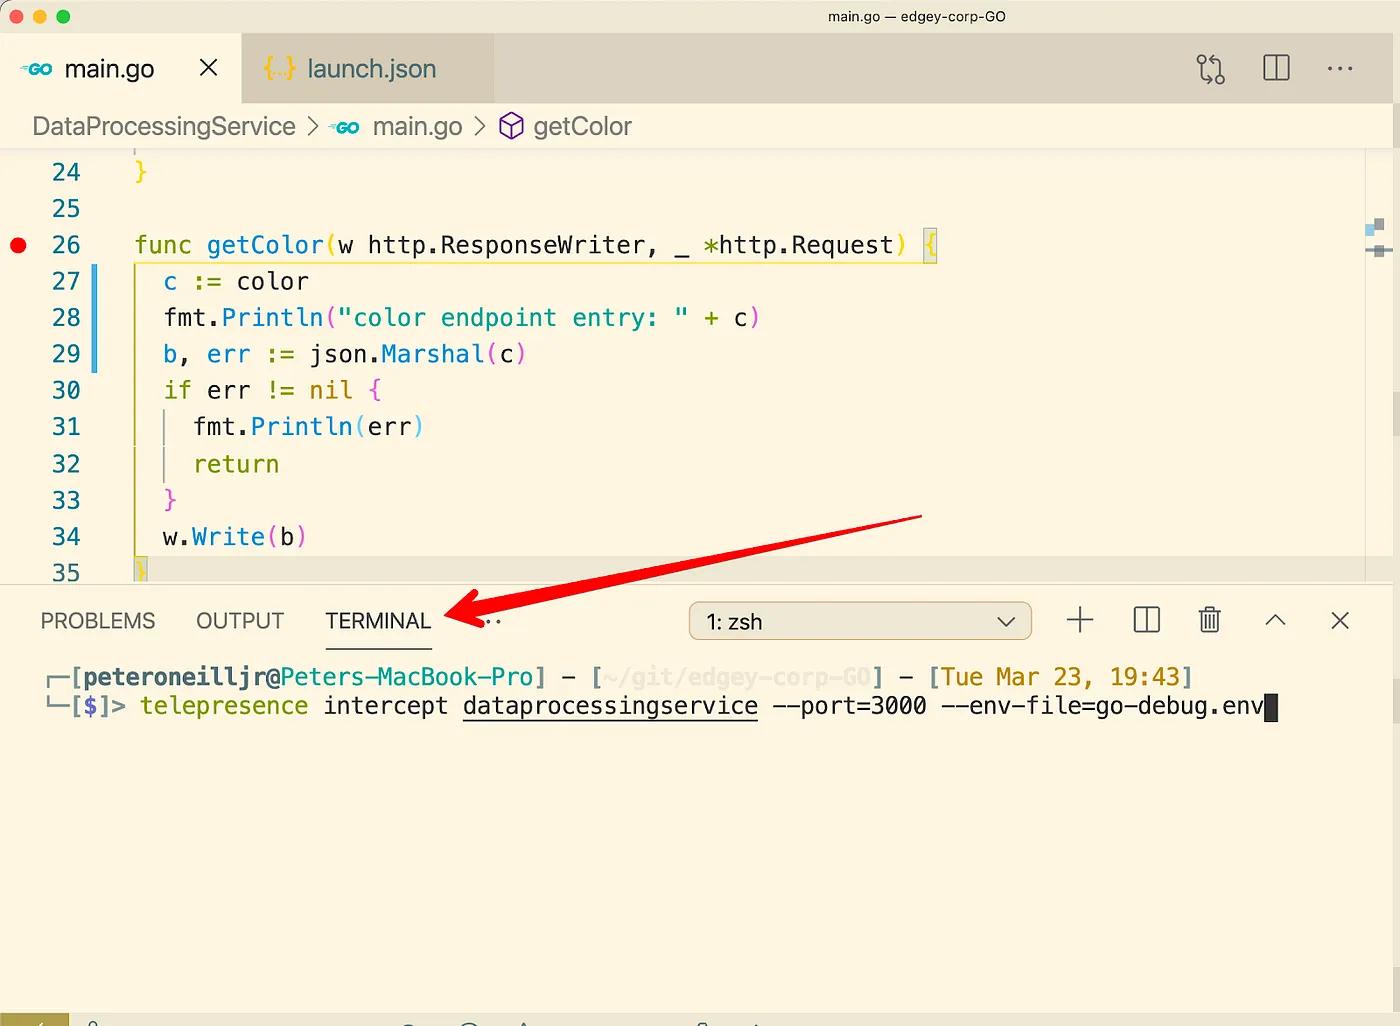
Finally, start the debug session. Click the debug icon on the right side and click the launch session button.
