You are a developer who enjoys experimenting while striving for optimal solutions. In the past, this was straightforward because your development work occurred on your own workstation. However, you now find yourself in a situation where your applications run within a container managed by a Kubernetes cluster. To implement any changes, you must first build a container and then deploy it to the cluster to have them tested.
When the container malfunctions, debugging becomes challenging; you are forced to rely on log outputs or various metrics to make educated guesses about the underlying issues.
The missing piece
Telepresence enables the interception of a container within the cluster, redirecting all its traffic to a container running on your local workstation. The local container will have access to identical environment variables, share the same mounted directories, and connect to a network that acts as a proxy for the cluster container's network.
Telepresence virtually positions the local container within the cluster, empowering you to debug, modify, rebuild, and restart the container as often as needed, all without the need to commit or deploy any of these changes.
Debugging the container
Remote run/debug configuration
Debugging code running in containers is fairly trivial. Typically, it involves a debugger frontend, often integrated into an IDE, which connects to a debugger backend in the container via a TCP port. The backend may be an integral part of a runtime environment like the Java Virtual Machine (JVM), or it could exist as a distinct binary application, exerting precise control over another compiled binary.
IDEs like JetBrains and VSCode can be configured to perform debugging via a TCP port.
Example using IntelliJ IDEA
Prerequisites:
- A running docker environment
- IntelliJ IDEA
- Telepresence 2.16.1 or later
- A Kubernetes cluster where the container can be deployed and intercepted
Prepare a container with a development and a production target
This example builds on the Docker Getting started with Java guide. Reading it is recommended.
We'll employ a Multi-stage Dockerfile as outlined in the guide. The development container runs the code using ./mvnw spring-boot:run with specific JVM options to enable debugging. On the other hand, the production container utilizes the java command to execute precompiled JAR files generated by ./mvnw package.
This Dockerfile is placed at the root of the project.
FROM eclipse-temurin:17-jdk-jammy as base
WORKDIR /app
COPY .mvn/ .mvn
COPY mvnw pom.xml ./
RUN ./mvnw dependency:resolve dependency:resolve-plugins
COPY src ./src
FROM base as development
CMD ["./mvnw", "spring-boot:run", "-Dspring-boot.run.jvmArguments='-agentlib:jdwp=transport=dt_socket,server=y,suspend=n,address=*:40000'"]
FROM base as build
RUN ./mvnw package
FROM eclipse-temurin:17-jre-jammy as production
EXPOSE 8080
COPY --from=build /app/target/spring-petclinic-*.jar /spring-petclinic.jar
CMD ["java", "-Djava.security.egd=file:/dev/./urandom", "-jar", "/spring-petclinic.jar"]
We also need a .dockerignore file to prevent intermediate files from the build being copied into the container. It contains one single line:
target
Build and push the image
Use docker to build and tag the image. In this example I use the docker registry “thhal”. You’ll need to swap that to a registry that you can push images to.
$ docker build . --tag petclinic --tag thhal/petclinic:1.0.0
$ docker push thhal/petclinic:1.0.0
Deploy the image in the cluster
We need a service and a deployment in the cluster, so we add the following petclinic.yaml to define those.
---
apiVersion: v1
kind: Service
metadata:
name: petclinic
spec:
type: ClusterIP
selector:
service: petclinic
ports:
- name: proxied
port: 80
targetPort: http
---
apiVersion: apps/v1
kind: Deployment
metadata:
name: petclinic
labels:
service: petclinic
spec:
replicas: 1
selector:
matchLabels:
service: petclinic
template:
metadata:
labels:
service: petclinic
spec:
containers:
- name: petclinic
image: thhal/petclinic:1.0.0
ports:
- containerPort: 8080
name: http
And then we apply that yaml using the command:
$ kubectl apply -f petclinic.yaml
Point your browser to the service. It should show the home page of the Petclinic app . See the tip below If your cluster doesn’t have an ingress controller configured that will allow you to access the service from a browser.
Prepare a Run/Debug Configuration in the IDE
In the IntelliJ IDE, you can create a “Remote Run/Debug Configuration”. Its only purpose is to connect to a debugger that runs on a given port. That’s exactly what we want.
- From the “Run” menu, select “Edit configurations”
- Click the plus-sign in the upper left corner.
- Select “Remote JVM Debug” in the list that appears.
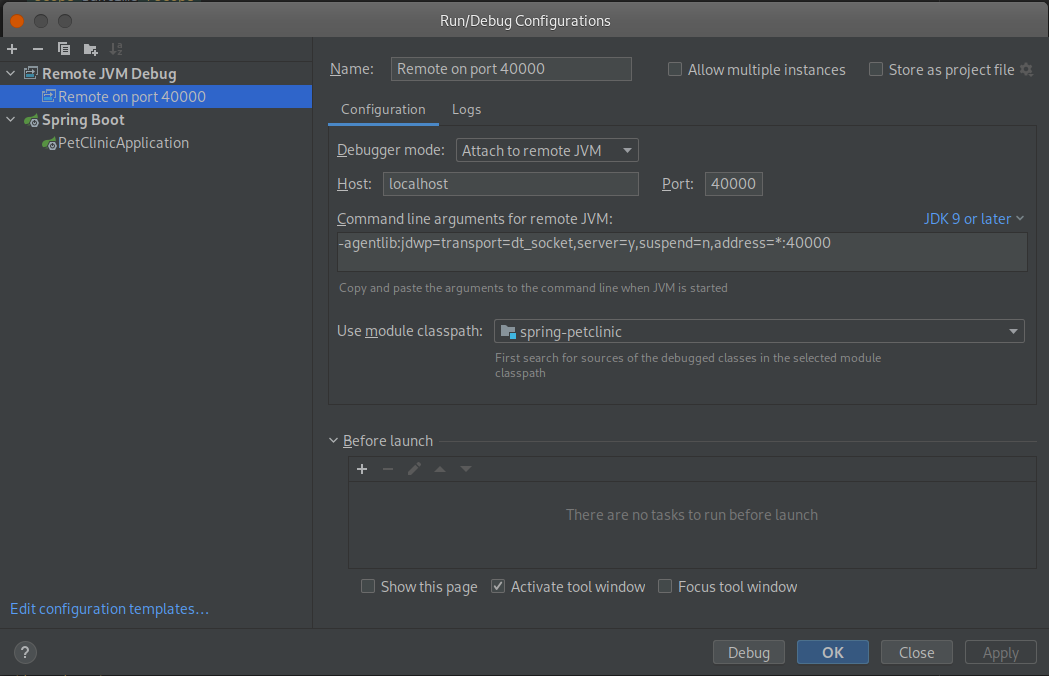
You’ll end up with a configuration that looks like this.

In this example, I named this configuration “Remote on port 40000”.
Connect Telepresence to the cluster
Use the following command to connect telepresence in docker mode so that the daemon runs in a container. We also use --expose 40000:40000 here to ensure that the port that the JVM will listen to can be reached from the IDE.
$ telepresence connect --docker --expose 40000:40000
Launching Telepresence User Daemon
Connected to context default, namespace default
Running the daemon in a container ensures that the proxied cluster network is isolated from the host network, and that any volume mounts are invisible to the host.
Add your breakpoints
Use the IDE to add some breakpoints to your source code.
Debug the intercept
Now start the intercept in a terminal using --docker-build flag so that it builds the development container, starts it, and ensures that it uses the correct network, environment, and volume mounts. Once the container is up and running, the Java debugger now awaits commands on port 40000.
$ telepresence intercept petclinic --docker-build . \
–-docker-build-opt target=development -- IMAGE
Start debugging
Start the debugger in your IDE using the “Remote on port 40000” configuration that we created above. Your debug session is now up and running. Try and send some traffic to the cluster that is routed to the intercepted service and watch your breakpoints get hit.
Modify code
Code modification is a four-step process.
- Modify the source code.
- Stop the Run/Debug configuration
- Start the intercept again.
- Start the Run/Debug configuration.
Example using Jetbrains Goland IDE
Prerequisites:
- A running docker environment
- Jetbrains Goland IDE
- Telepresence 2.16.1 or later
- Source code for the docker container
- A Kubernetes cluster where the container is deployed and interceptable
The source code used in this example can be found here.
Prepare a debug version of the container
Go is a compiled language, and debugging requires a debugger called Delve to control the binary. This implies that the container hosting the binary must also include Delve, necessitating a Dockerfile specifically customized for this purpose.The original container (the one running in the cluster) used for this example is built from this Dockerfile
FROM golang:alpine AS builder
WORKDIR /echo-server
COPY go.mod .
COPY go.sum .
# Get dependencies - will also be cached if we won't change mod/sum
RUN go mod download
COPY frontend.go .
COPY main.go .
RUN go build -o echo-server .
FROM alpine
COPY --from=builder /echo-server/echo-server /
CMD ["/echo-server"]
We name the Delve annotated copy Dockerfile.debug
FROM golang:alpine AS builder
# Build Delve
RUN go install github.com/go-delve/delve/cmd/dlv@latest
WORKDIR /echo-server
COPY go.mod .
COPY go.sum .
# Get dependencies - will also be cached if we won't change mod/sum
RUN go mod download
COPY frontend.go .
COPY main.go .
RUN go build -gcflags="all=-N -l" -o echo-server .
EXPOSE 40000
CMD ["/go/bin/dlv", "--listen=:40000", "--headless=true", "--api-version=2", "--accept-multiclient", "exec", "/echo-server/echo-server"]
Notable additions to the debug container are:
- Go build disables inlining and optimizations using --gcflags=”all=-N -l”
- Delve is installed
- The container exposes port 40000 (any free port can be used here).
- The CMD is modified so that Delve listens to the exposed port and executes the go binary.
- The extra FROM and COPY steps to minimize the container are removed because this container will never be published
Prepare a Run/Debug Configuration in the IDE
In the Goland IDE, you can create a “Go Remote Run/Debug Configuration”. Its only purpose is to connect to a debugger that runs on a given port. That’s exactly what we want.
From the “Run” menu, select “Edit configurations”- Click the plus-sign in the upper left corner.
- Select “Go remote” in the list that appears.
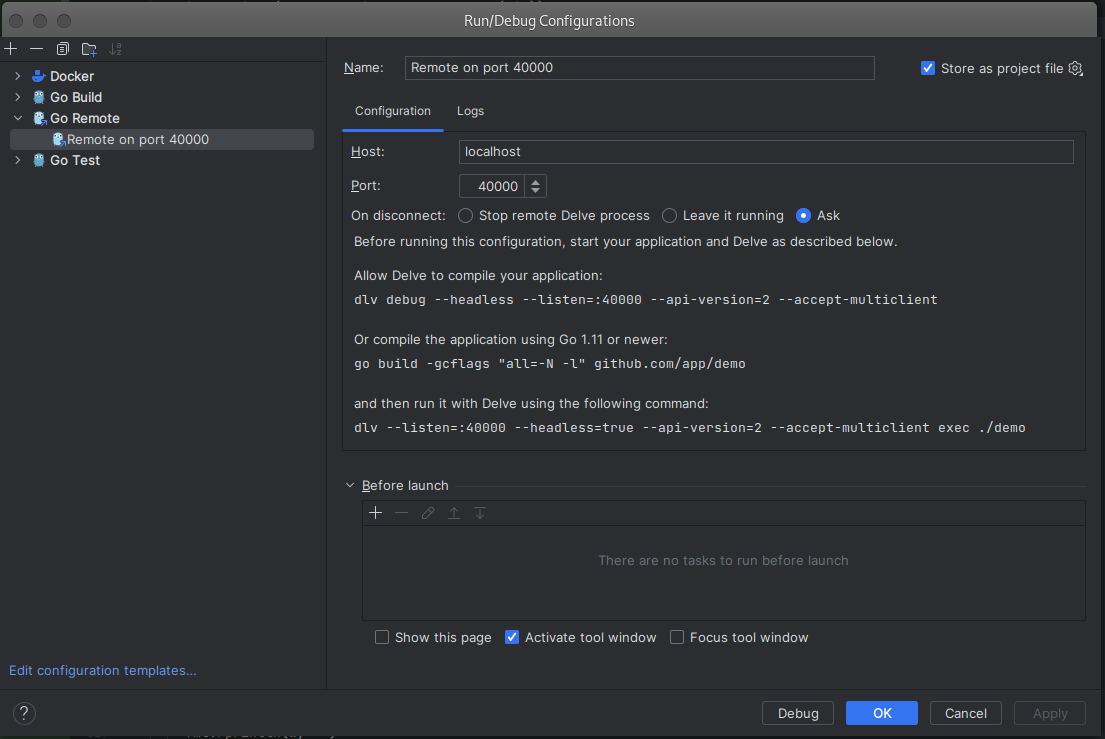
You’ll end up with a configuration that looks like this.

In this example, I named this configuration “Remote on port 40000”.
Connect Telepresence to the cluster
Use the following command to connect telepresence in docker mode so that the daemon runs in a container. We also use --expose 40000:40000 here to ensure that the port that Delve will listen to can be reached from the IDE.
$ telepresence connect --docker --expose 40000:40000
Launching Telepresence User Daemon
Connected to context default, namespace default
Running the daemon in a container ensures that the proxied cluster network is isolated from the host network, and that any volume mounts are invisible to the host.
Add your breakpoints
Use the IDE to add some breakpoints to your source code.
Debug the intercept
Now start the intercept in a terminal using --docker-debug flag. This starts the container with relaxed security and ensures that it uses the correct network, environment, and volume mounts. Once the container is up and running, the Delve debugger now awaits commands on port 40000.
$ telepresence intercept echo --docker-debug Dockerfile.debug -- IMAGE
It’s assumed that the name of the cluster deployment that runs our container remotely is “echo”.
Start debugging
Start the debugger in your IDE using the “Remote on port 40000” configuration that we created above. Your debug session is now up and running. Try and send some traffic to the cluster that is routed to the intercepted service and watch your breakpoints get hit.
Modify code
Code modification is a four-step process.
- Modify the source code.
- Stop the Run/Debug configuration
- Start the intercept again.
- Start the Run/Debug configuration.
This example was inspired by the excellent Goland blog-post Debugging a Go application inside a Docker container.
Tips
Just run the container
Just build and run the original container using the following command If you just want to try out source changes without starting a debugger:
Copy
$ telepresence intercept echo --docker-build . -- IMAGE
Bash with cluster network access
Start a bash shell with cluster network access so that you can curl your services by name. The trick here is to start a container that uses the same network as the Telepresence daemon. The name of that network is included in the output from the telepresence status command.
Copy
$ docker run --network $(telepresence status --output json | jq -r .user_daemon.container_network) \
--rm -it jonlabelle/network-tools
[network-tools]$ curl echo
Request served by echo-76547fc7f8-hr2sg
GET / HTTP/1.1
Host: echo
Accept: */*
User-Agent: curl/8.3.0
On a windows box, you’ll need to first execute the telepresence status command, copy the entry for the “Container network” and then use that for the --network option in the docker run command.
See jonlabell/network-tools for more information about this very useful container.
Browser access without Ingress
You can utilize Kubernetes port-forwarding to establish a connection between your browser and a service within your cluster. This proves especially useful when you lack a dedicated ingress for the service. For instance, if you have a "petclinic" service running on port 80 (as demonstrated in the Java example) and you wish to access it from your browser, you can achieve this by executing the following command in your terminal, which maps "localhost:8080" to that service::
$ kubectl port-forward svc/petclinic 8080:80
Now point your browser to http://localhost:8080/

